Where ideas become visuals.
A curated look at how I turn complex information into clear, compelling visual stories.
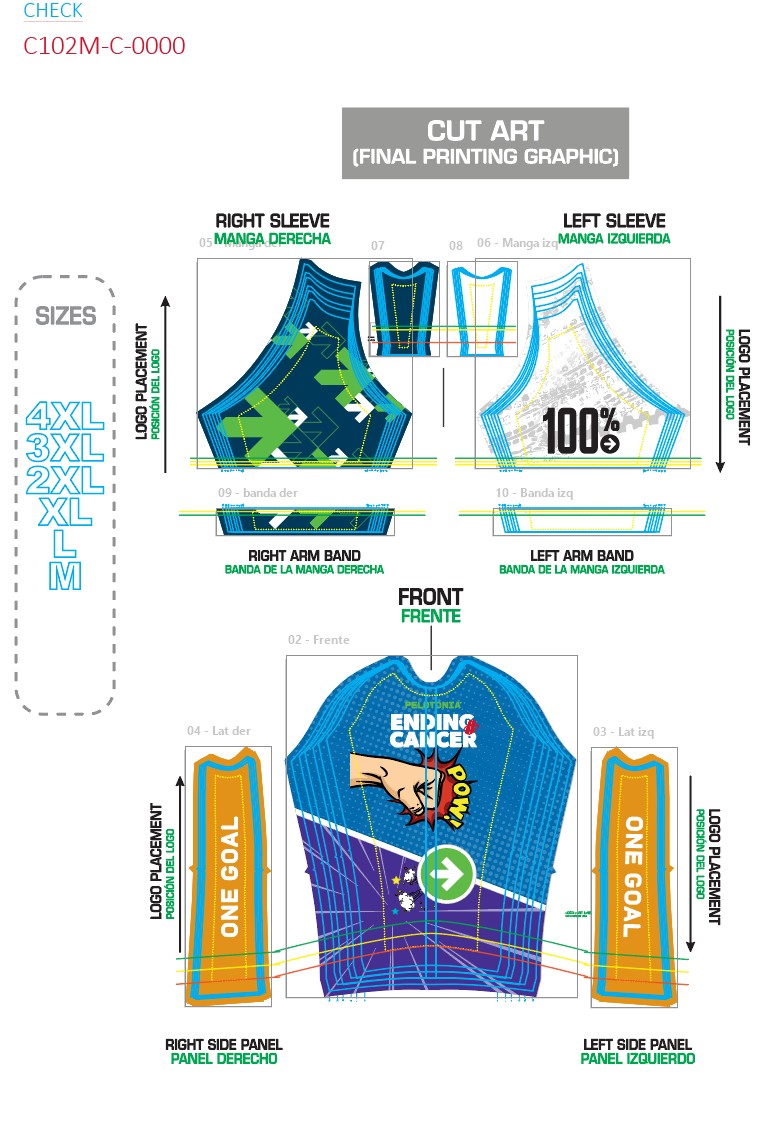
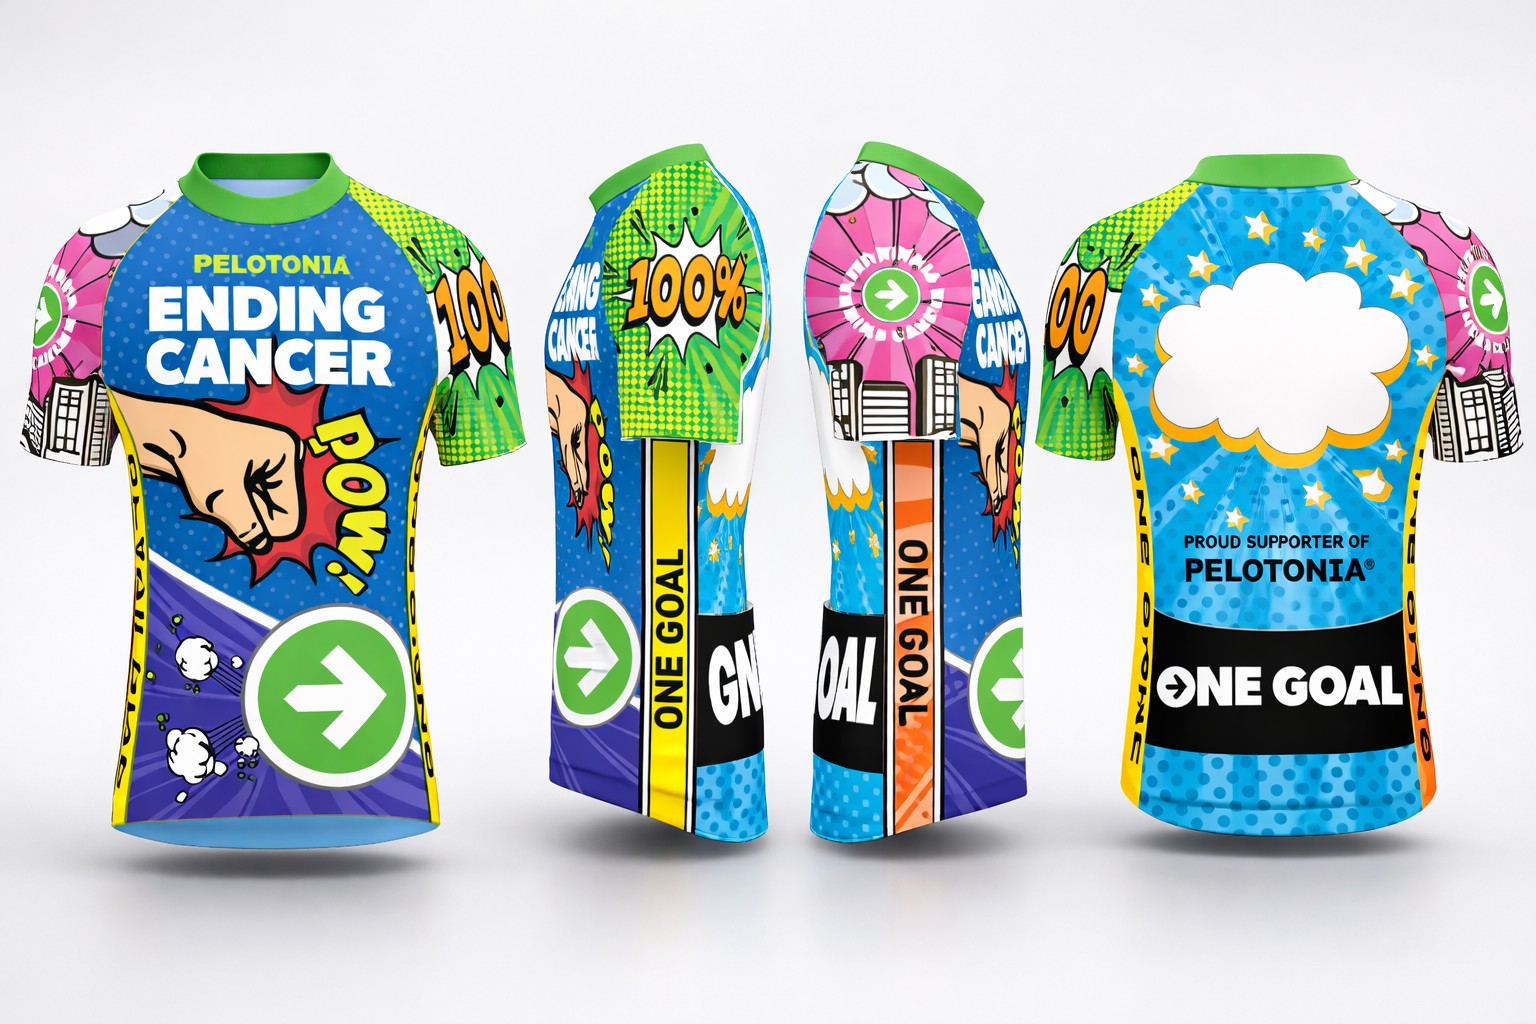

From Flat to Life
Started as a flat concept, but needed to work in the real world. I mapped every panel, seam, and placement in Illustrator, then brought it into 3D and AI to see it fully come to life before production. I care about making ideas tangible, something people can see, understand, and feel connected to.
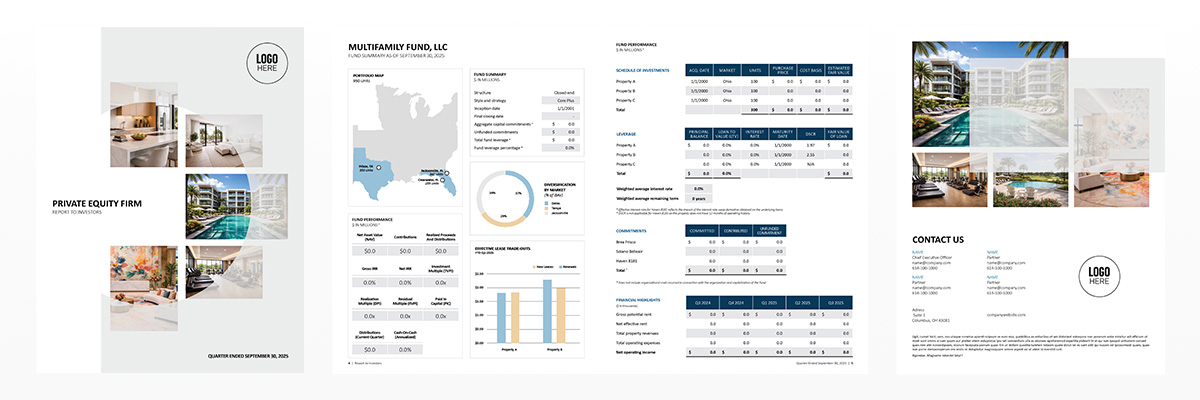
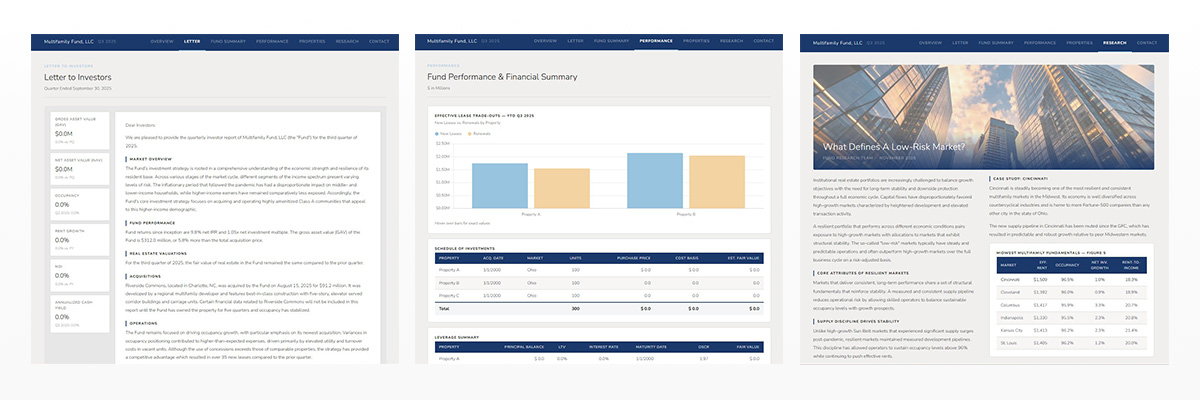
One Report, Two Lives
A quarterly report has to work in two worlds: print and digital. I focused on structure, hierarchy, and flow to make complex financial data easier to read, understand, and actually use. I like making complex information easier to understand, whether it’s for leadership, teams, or a broader audience.
The Playground Got Bigger
Made with Firefly, Canva, ChatGPT, and Claude. Fast? Yes. Effortless? Not quite. Behind every AI output is someone who understands light, color, hierarchy, and intent. The tools expanded the playground. The creative still has to know the game.
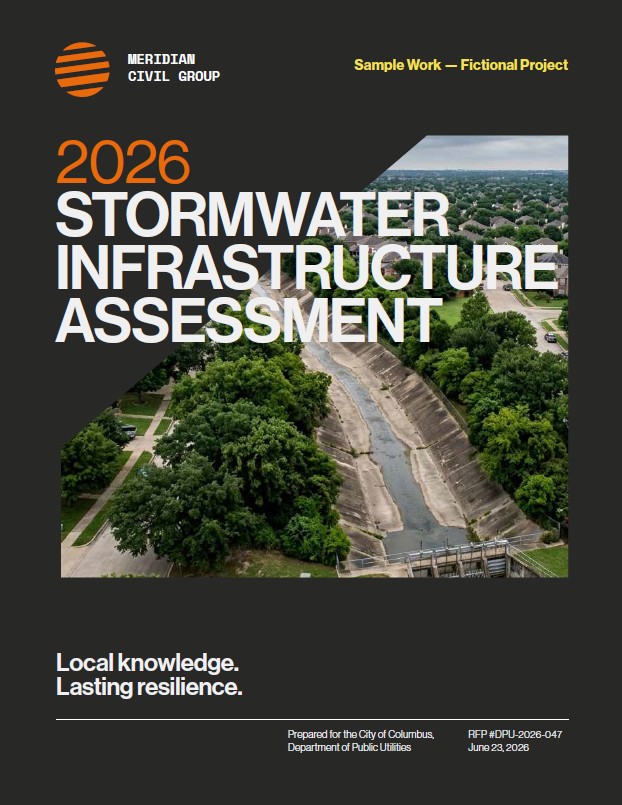
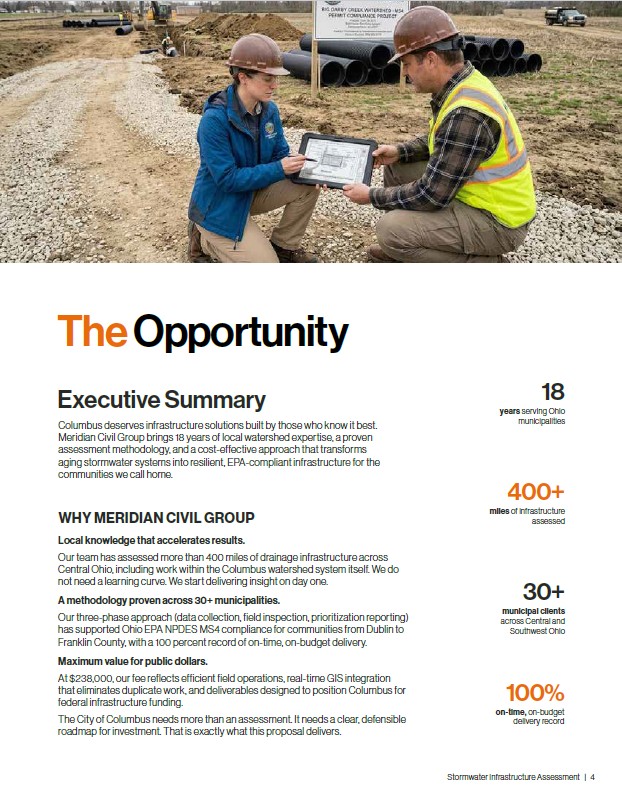
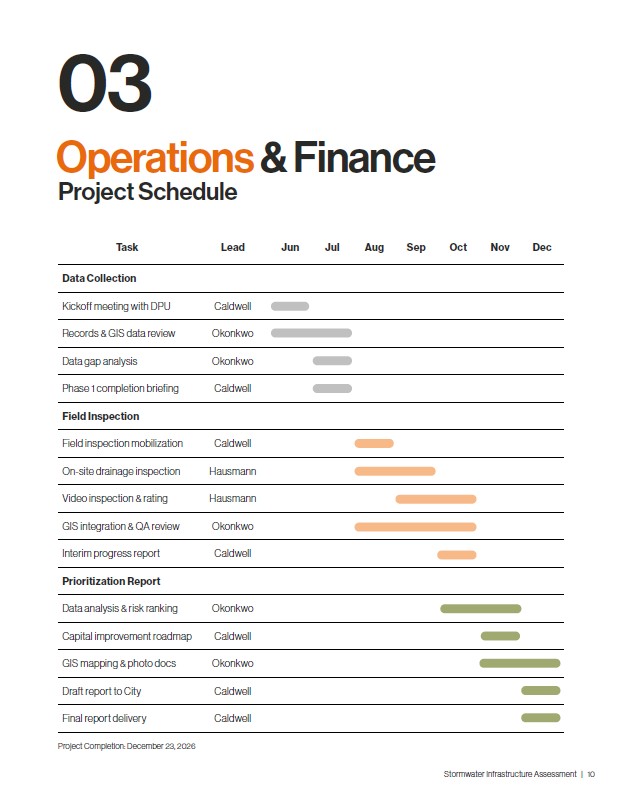
From Blank Page to Bid-Ready
A 16-page proposal built to show how page layout and visual hierarchy make technical content, schedules, financial tables, compliance matrices, feel clear and easy to navigate. Text drafted with Claude, imagery generated with Google Gemini. All content, including the firm name, is entirely fictional.